SteerPlex: Estimating Scenario Complexity for Simulated Crowds
Glen Berseth1, Mubbasir Kapadia2 and Petros Faloutsos1
1York University 2Disney Research Zurich
Complexity of simulated worlds has increased dramatically in recent years
 Hitman Absolution
Can we compute the complexity of a scenario before simulation?
|
|
|
How can we objectively conclude which one is more difficult to solve?
There are many mature solutions for dynamic navigation
 Egocentric
|
 PPR
PPR
|
 Footstep
|
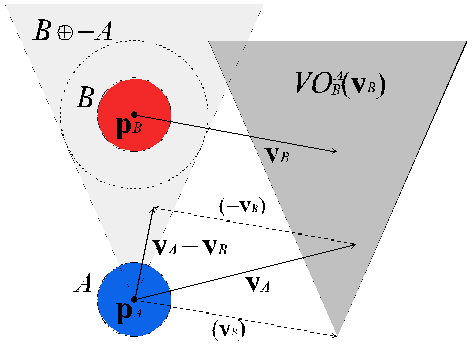 RVO
RVO
|
| [Kapadia et al, 09] |
[Singh et al, 09]
|
[Singh et al, 11]
|
[van den Berg et al, 08]
|
We use PPR, Egocentric and Footstep for this work
Related Work
- Environment verification methods [Perkins 2010; Penn 2001] focuse on the validation of a layout using metrics such as connectivity and visibility
- Our method focuses on the static analysis of environment configurations to extract meaningful features which quantify the complexity of dynamic crowd motion
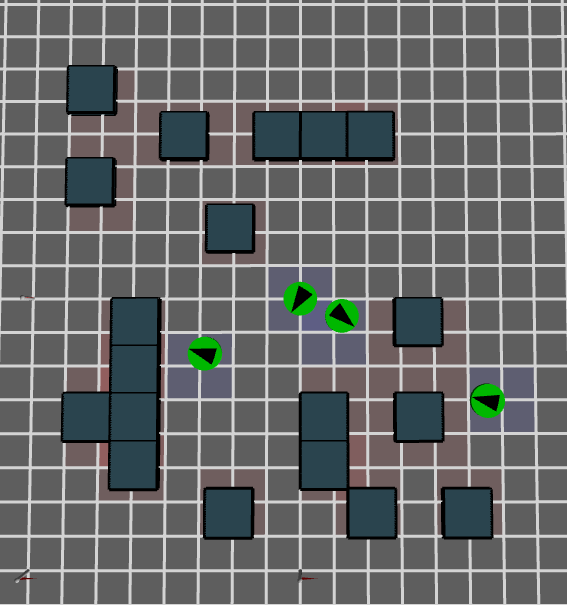
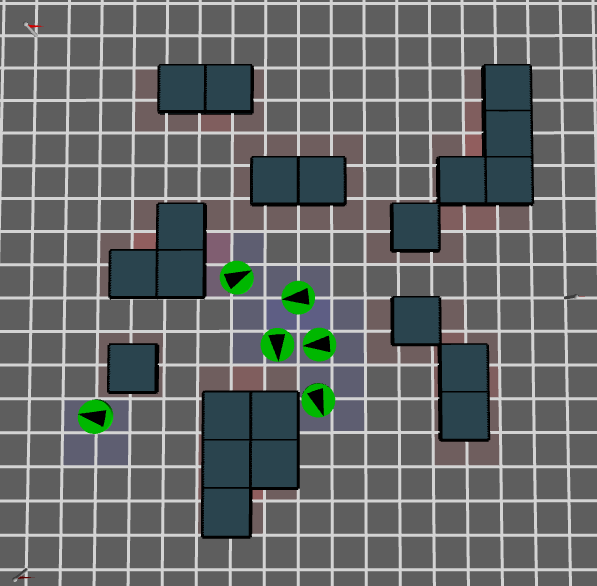
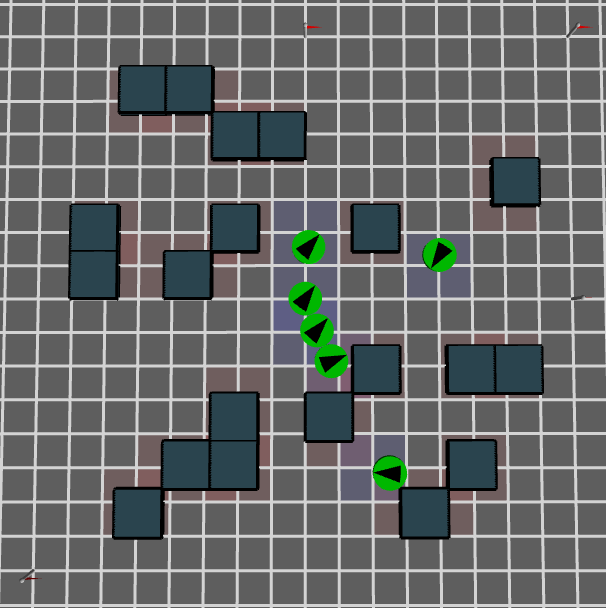
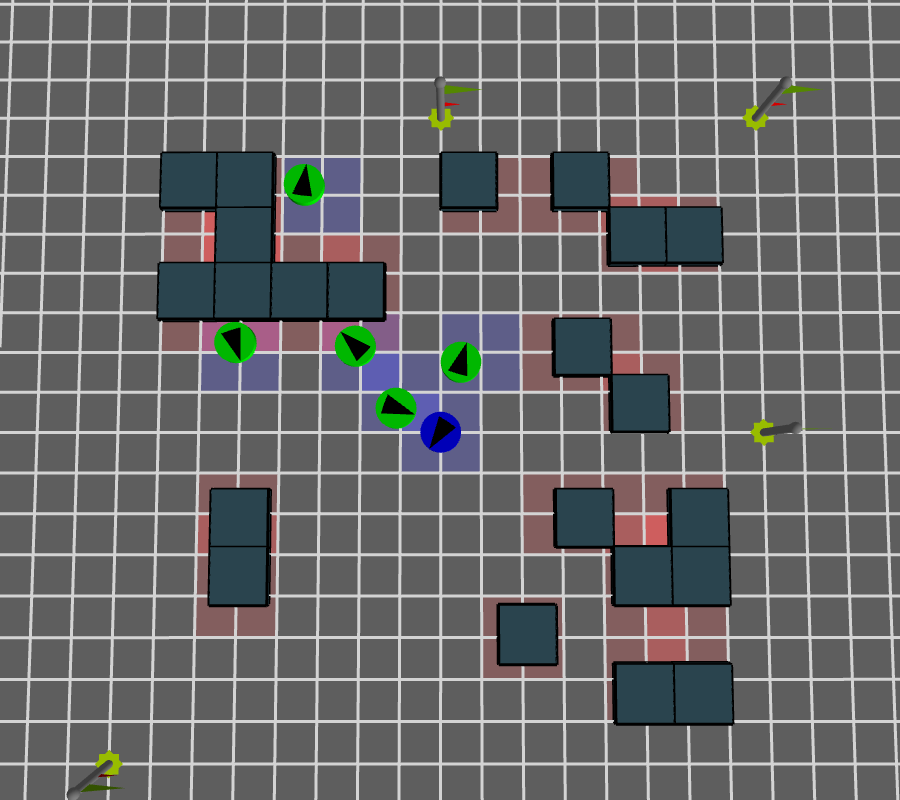
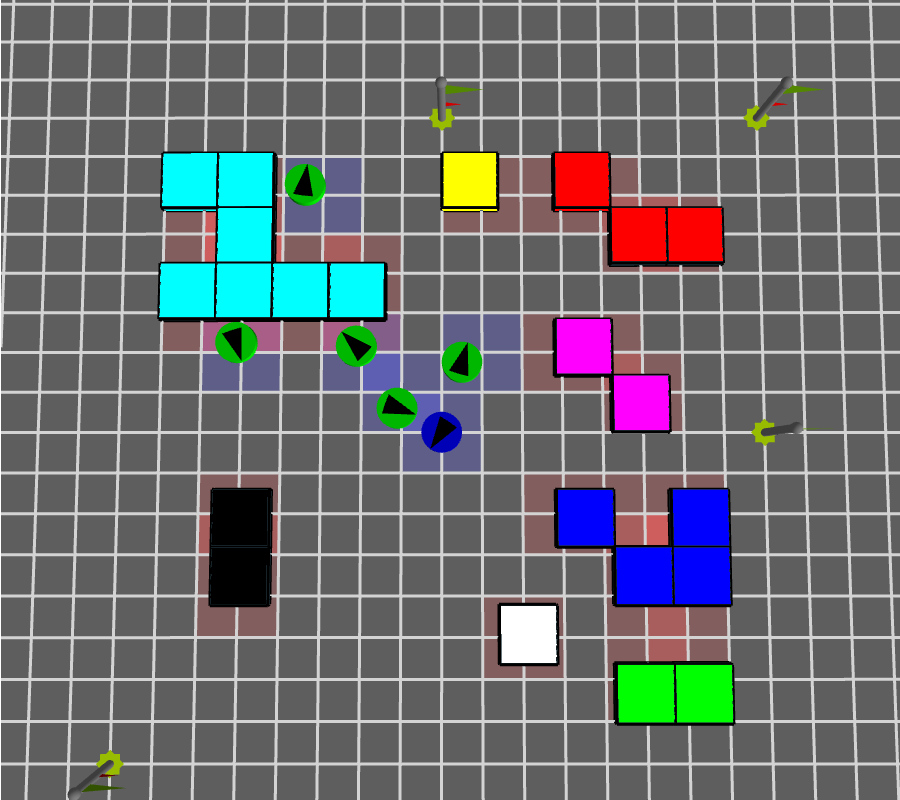
Representative set of Scenarios
We randomly construct scenarios with the following constraints
- The reference agent (blue) is placed at the origin (0,0)
- The static path of each agent must intersect the reference agent’s static path.
- Each agent \( a \in \mathbb{A} \) must have a valid static optimal path from its initial position to its target.
- The scenario is limited to a minimum of 3 and a maximum of 6 agents.
[Kapadia et al. 2011]
Simulation Metrics
Used to evaluate steering algorithms post-simulation
-
Coverage \( c(A)\):
Reference agent reaches its goal without collisions and number of collision is less than the number of agents
-
Distance Quality \( q(A)\):
Ratio of distance traveled to optimal distance to reach goal, penalizing deviation from staic optimal path
-
Computational Performance \( p(A)\):
Average time spent computing steering decision for an agent
[Kapadia et al. 2011]
Complexity formulation
Scenario Definition
A scenario \( s \) consists of two sets:
$$ s = \langle \mathbb{O}, \mathbb{A} \rangle $$ |
|
Each agent is a tuple of {position, desired velocity, initial facing direction and target position}
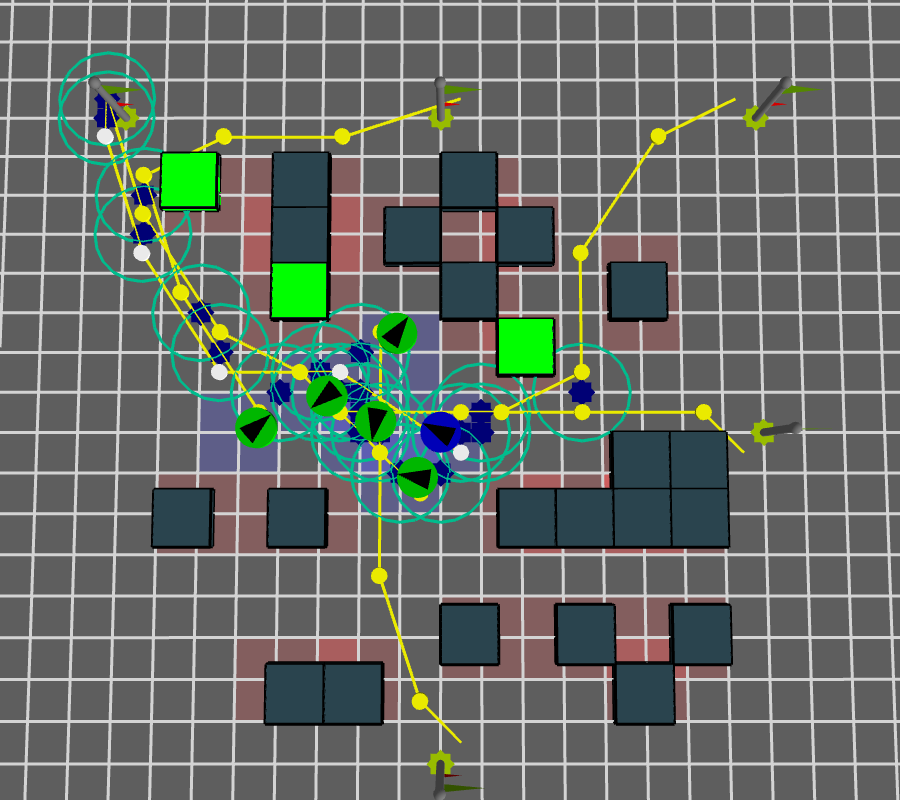
Scenario Annotation
|
Obstacle groupsObstacles are grouped together into clusters that consist of any overlaping or touching static obstacles |
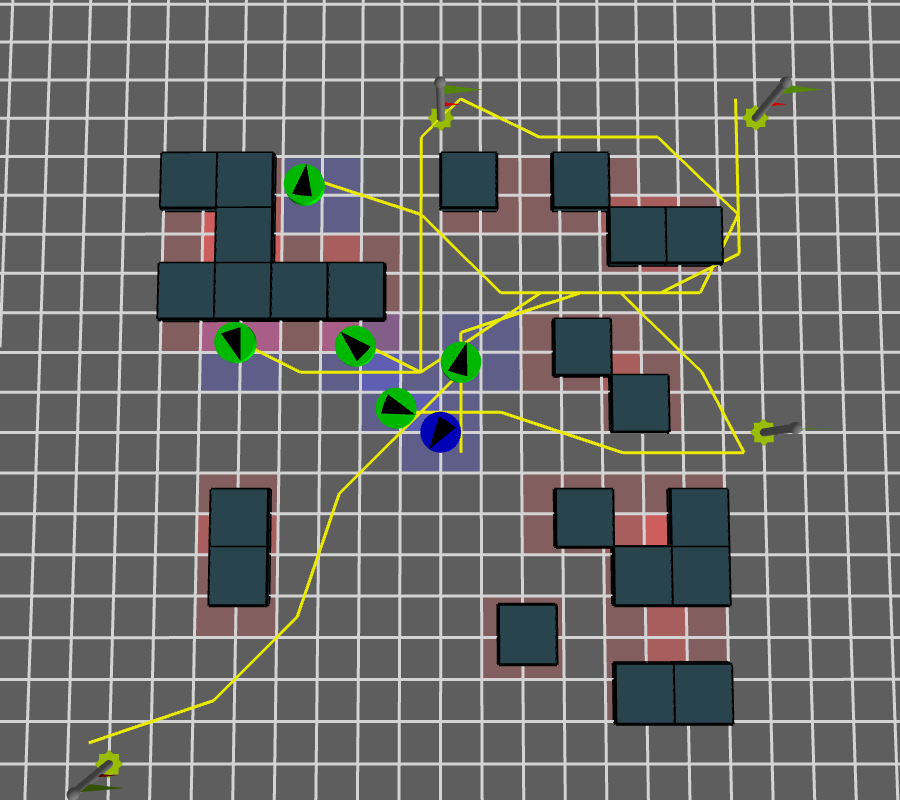
|
Space-time pathsPaths are computed for each agent that consist of points in both space and time from initial position to target |
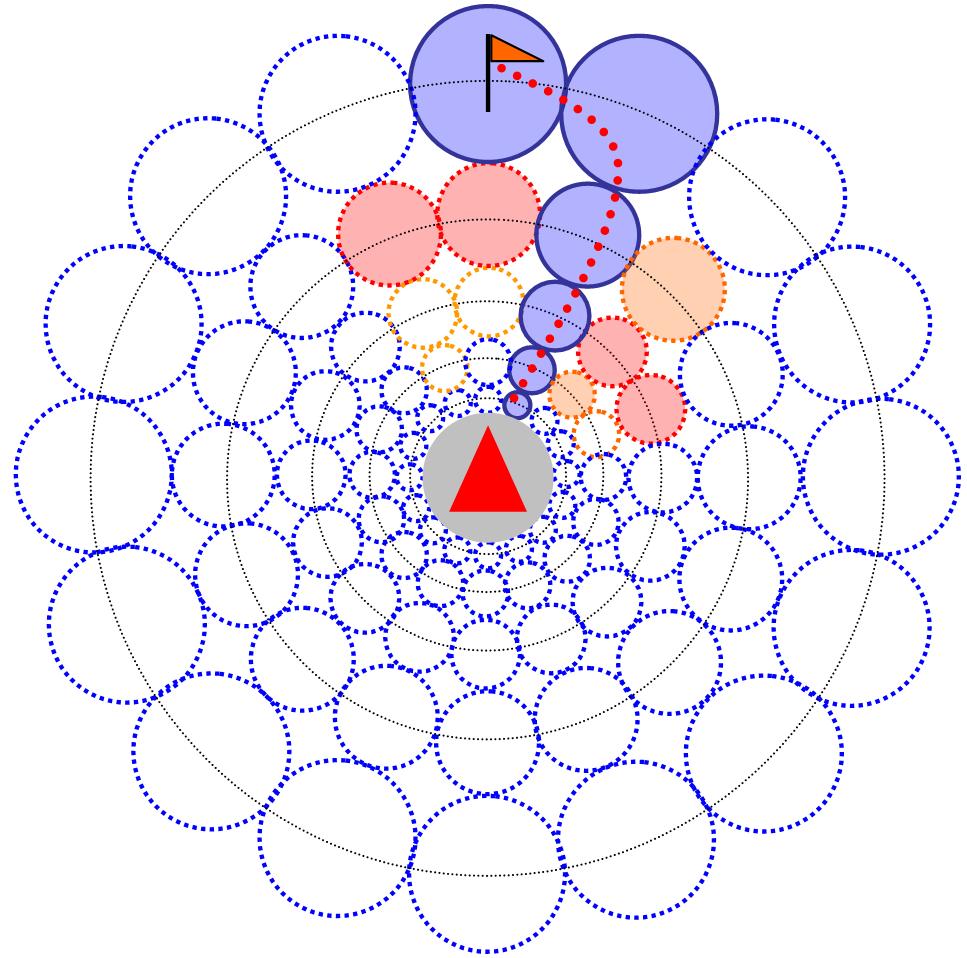
Complexity features
Number of obstacle groups
\( f_{og} \)
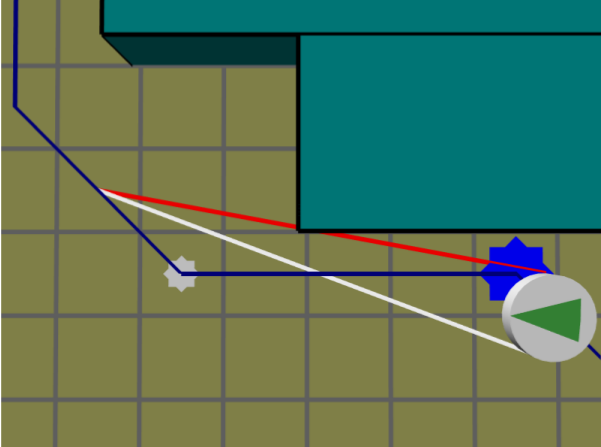
Number of expected interactions
\( f_{i} \)
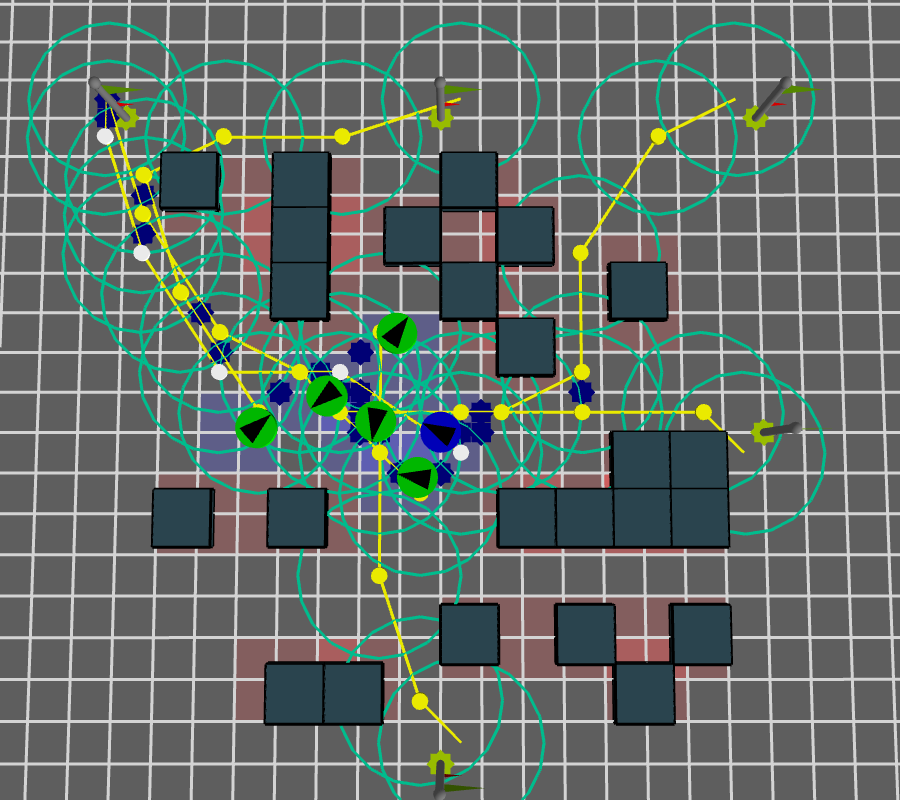
The light blue circles describe the area of expected interaction \( \epsilon_{d} \). The blue stars are expected interactions points in space-time
Number of expected interactions with Reference Agent
\( f_{i}^{ref} \)
The orange stars are expected space-time interactions points with the reference agent
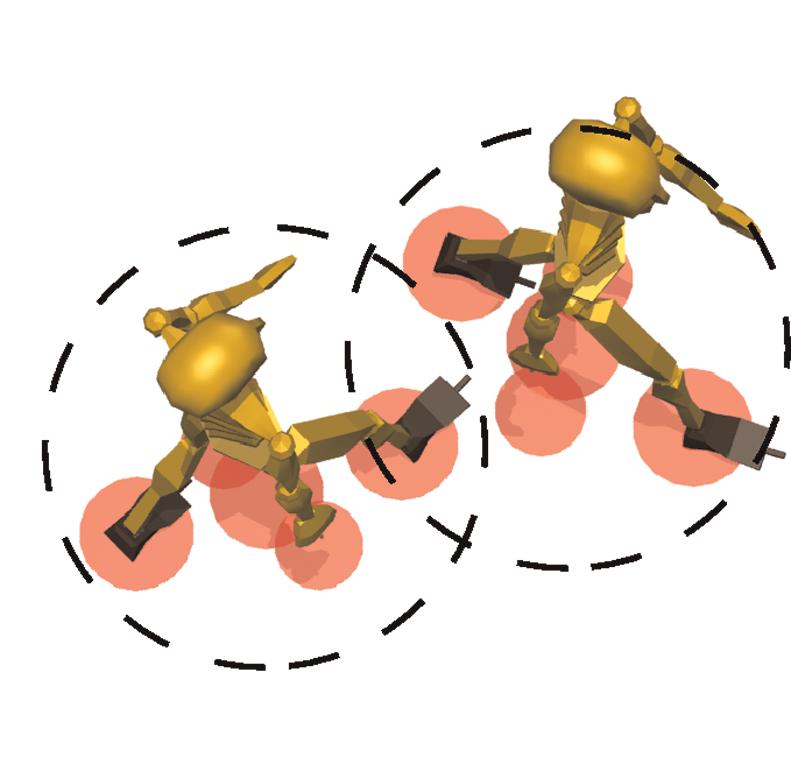
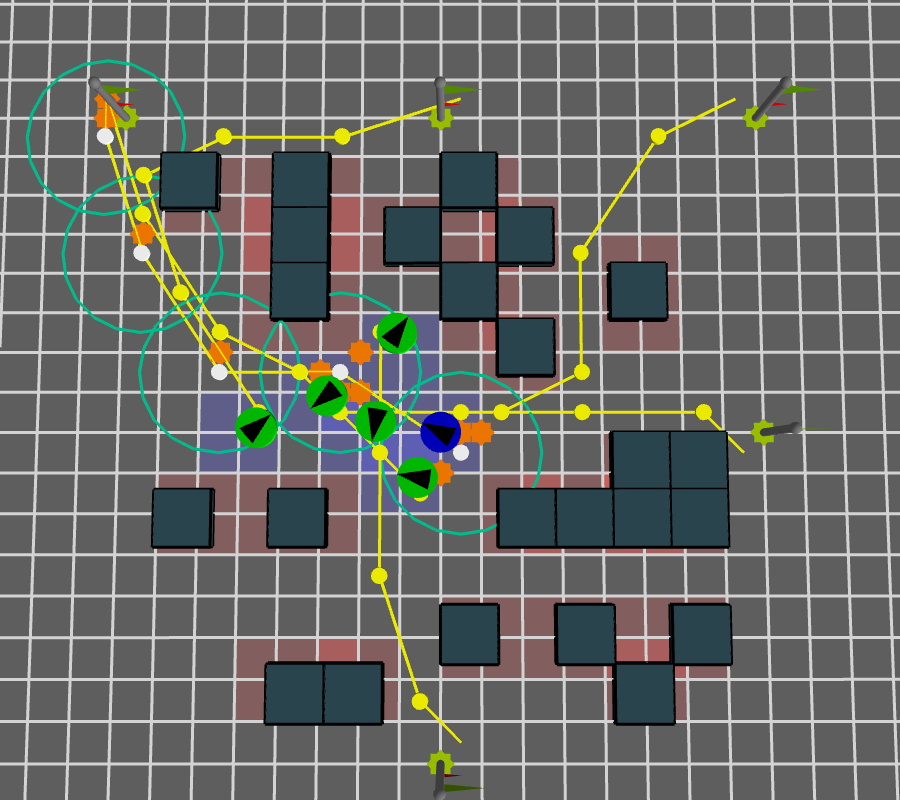
Space-Time co-located interactions and obstalces
\( f_{ci}, f_{o} \)
For each expected interaction we check for other interactions and obstalces in the radius of influence \( r_{inf} \) and within a given time \( \epsilon_t \)
Space-Time co-located interactions and obstalces with reference agent
\( f_{ci}^{ref} \)
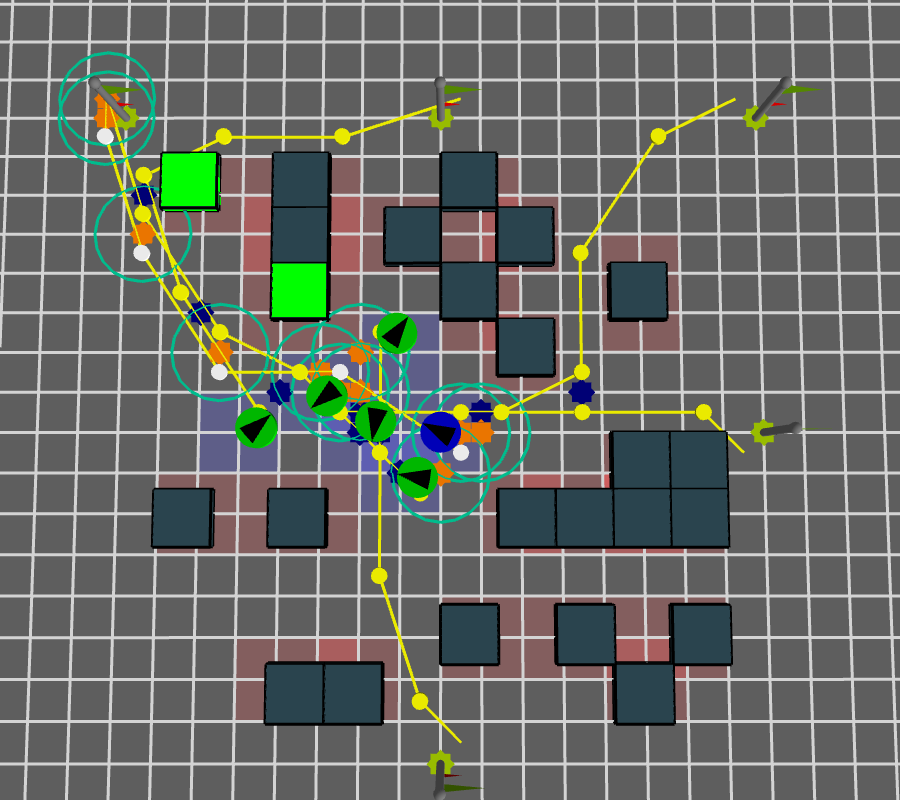
We do the same for the reference agent
Open space in area of expected interactions
\( f_{open} \)
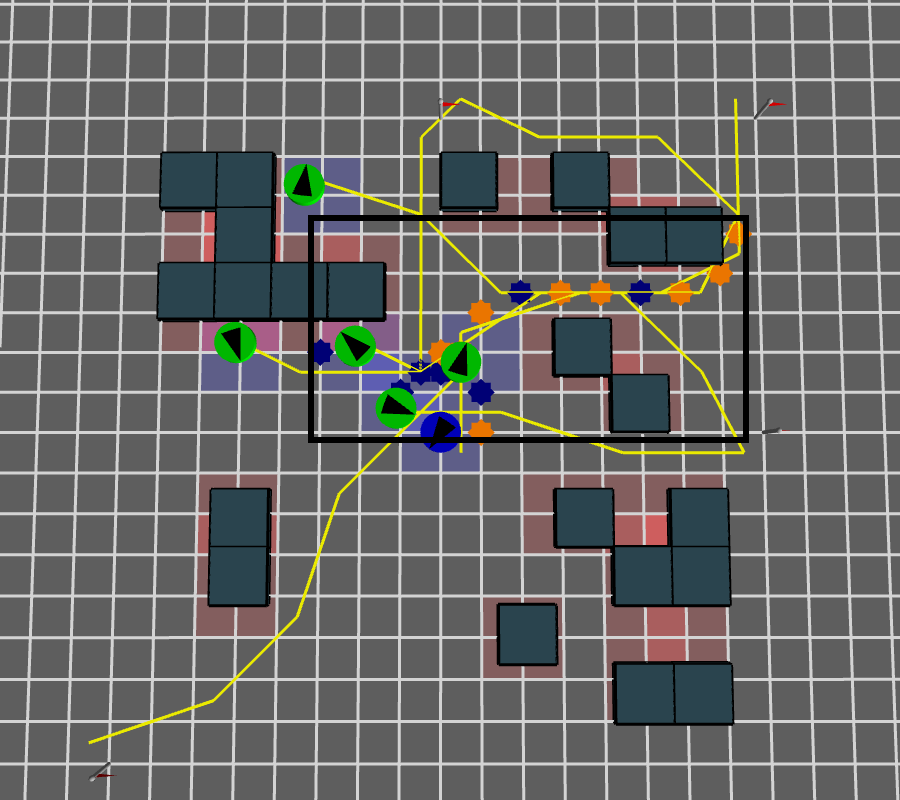
The area of the box that bounds all interactions points minus the area of the obstacles in that box.
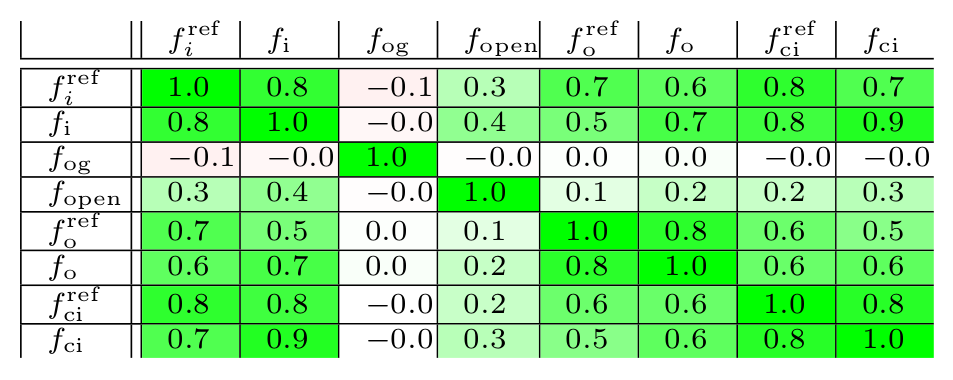
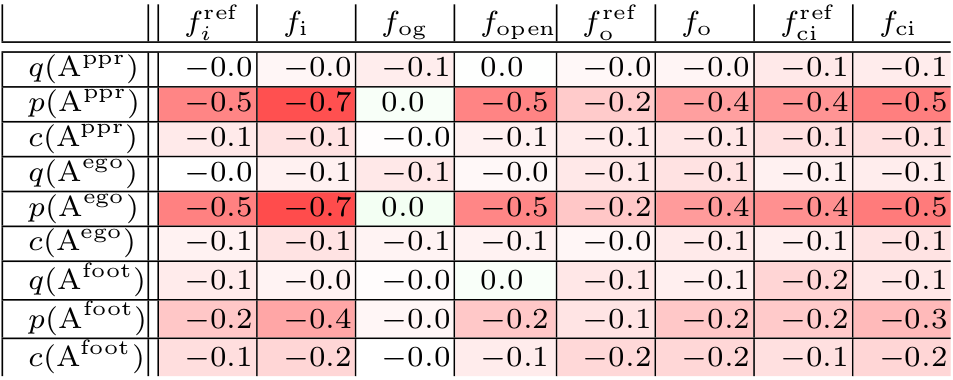
Experiments and Analysis
correlation analysis over representative set
|
|
|
|
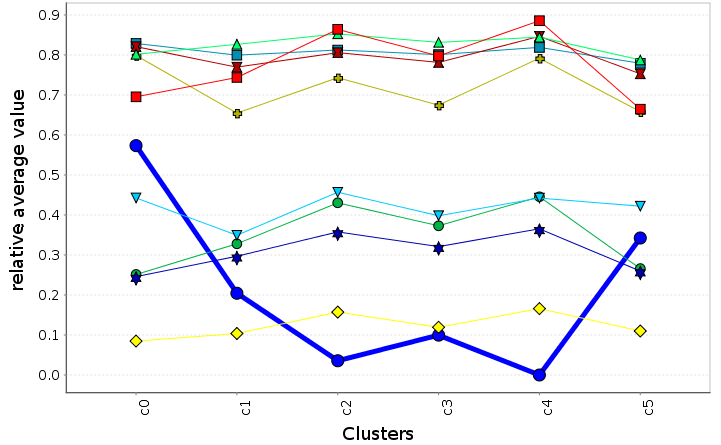
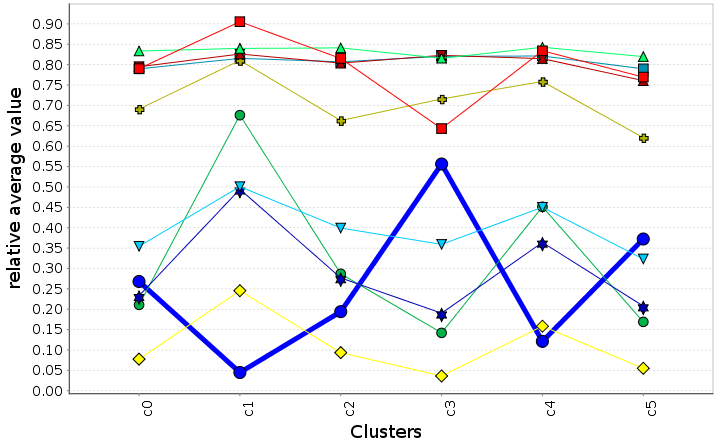
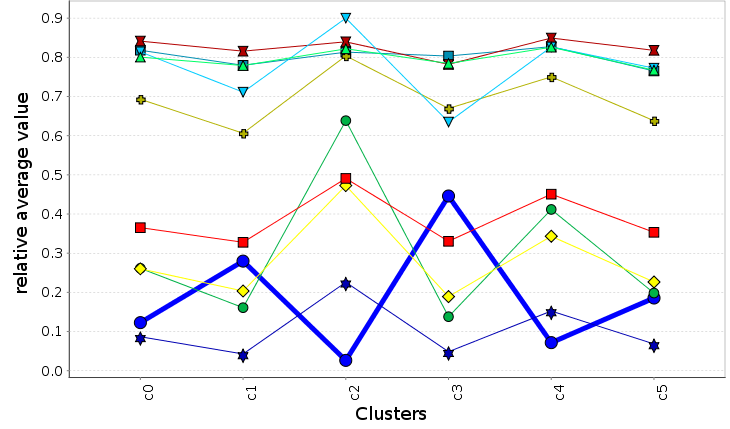
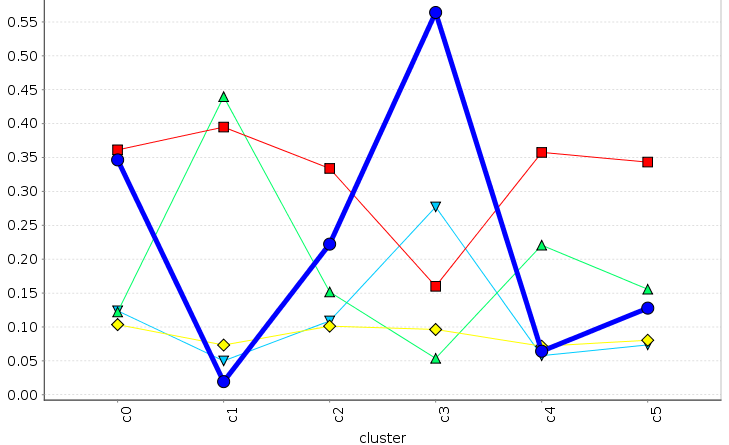
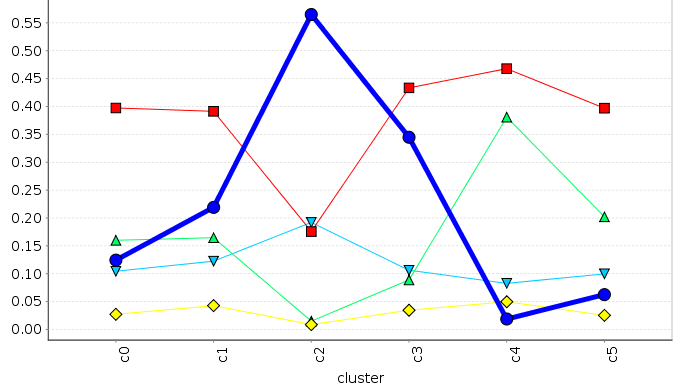
Data clustering analysis
We use data clustering techniques to group scenarios together with similar feature values and compute the average metrics for these clusters
 \( f_{o}^{ref} \)

|
 \( f_{i} \)
|
\( c(A^{ppr}) \)
 \( p(A^{ppr}) \)
 \( q(A^{ppr}) \)
 \( c(A^{ego}) \)
 \( p(A^{ego}) \)
 \( q(A^{ego}) \)
 \( c(A^{foot}) \)
 \( p(A^{foot}) \)
 \( q(A^{foot}) \)

|
Feature combination and analysis
$$ \mathbb{F} = \langle f_i, f_{i}^{ref}, f_{i}^{ref}, f_{o}, f_{o}^{ref}, f_{ci} , f_{ci}^{ref}, f_{open}, f_{og} \rangle $$ $$ f_{comp} = \sum_{\forall f_i \in F} w_i f_i $$Principal Component Analysis
We weight each feature proportion to the variance calculated from the PCA analysis of the features
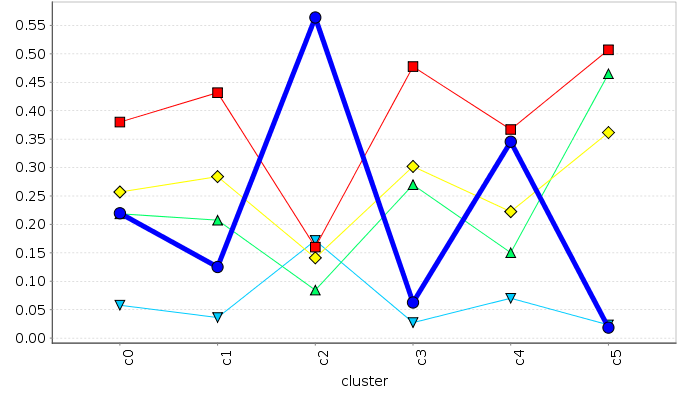
Complexity Clustering Comparison
 \( f_{comp} \)
|
\( c(A^{ppr}) \)
\( p(A^{ppr}) \)
\( q(A^{ppr}) \)
\( c(A^{ego}) \)
\( p(A^{ego}) \)
\( q(A^{ego}) \)
\( c(A^{foot}) \)
\( p(A^{foot}) \)
\( q(A^{foot}) \)
|
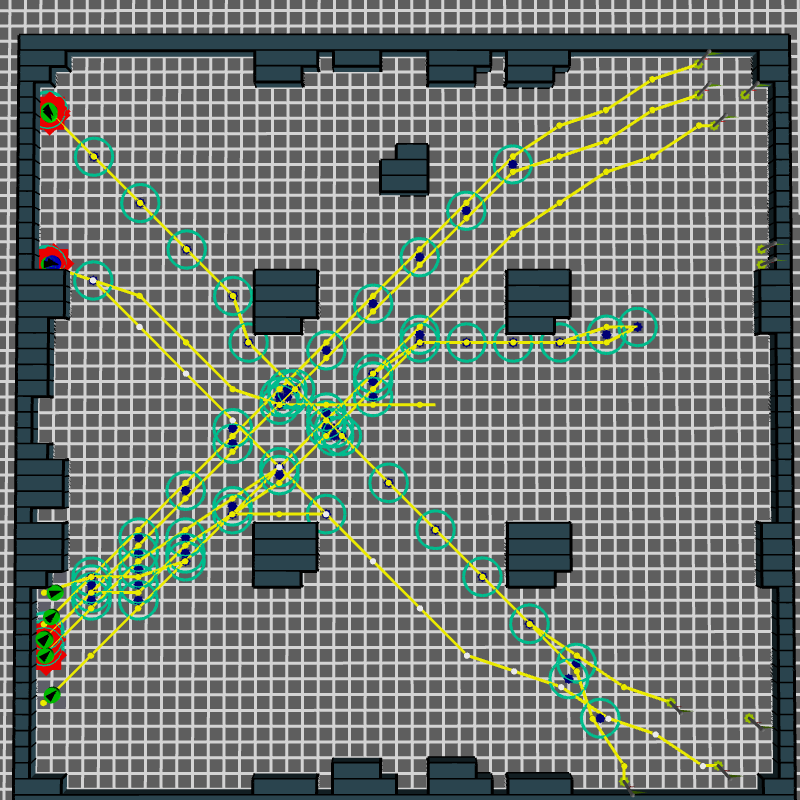
Example scenarios
SteerBench analysis
$$ f_{comp} = 44,000 $$ |
$$f_{comp} = 110,000$$ |
$$ f_{comp} = 460,000 $$ |
Decreasing the number of exits and width of the exit leads to increased expected interactions between agents
[Singh et al. 2009]
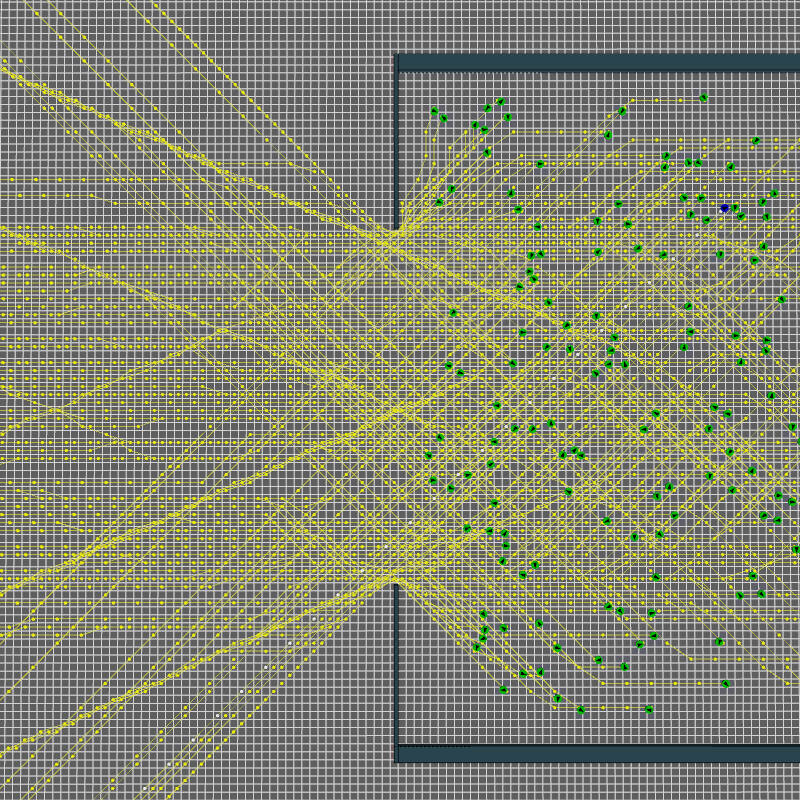
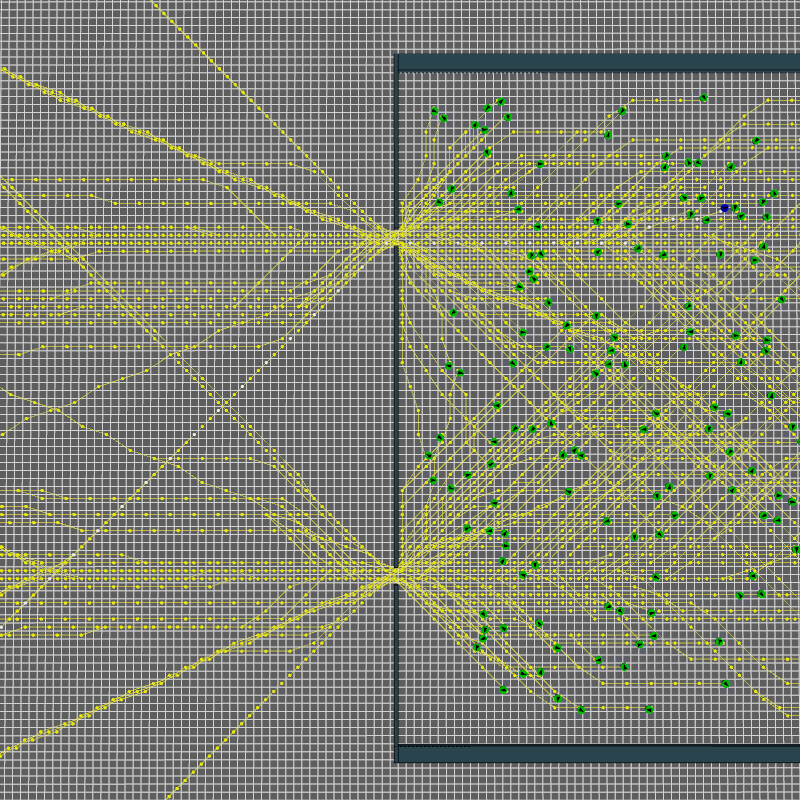
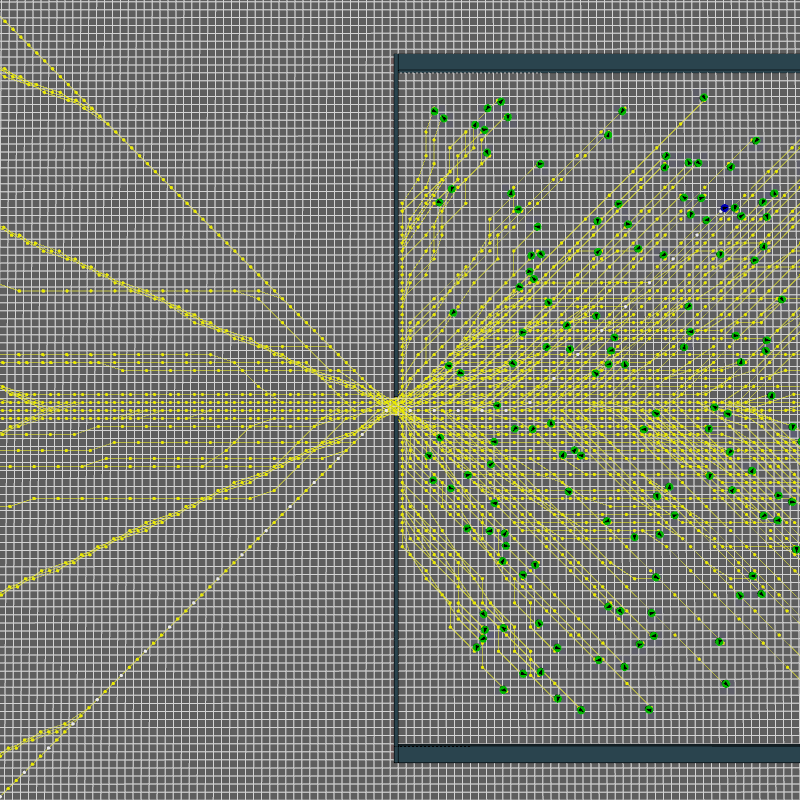
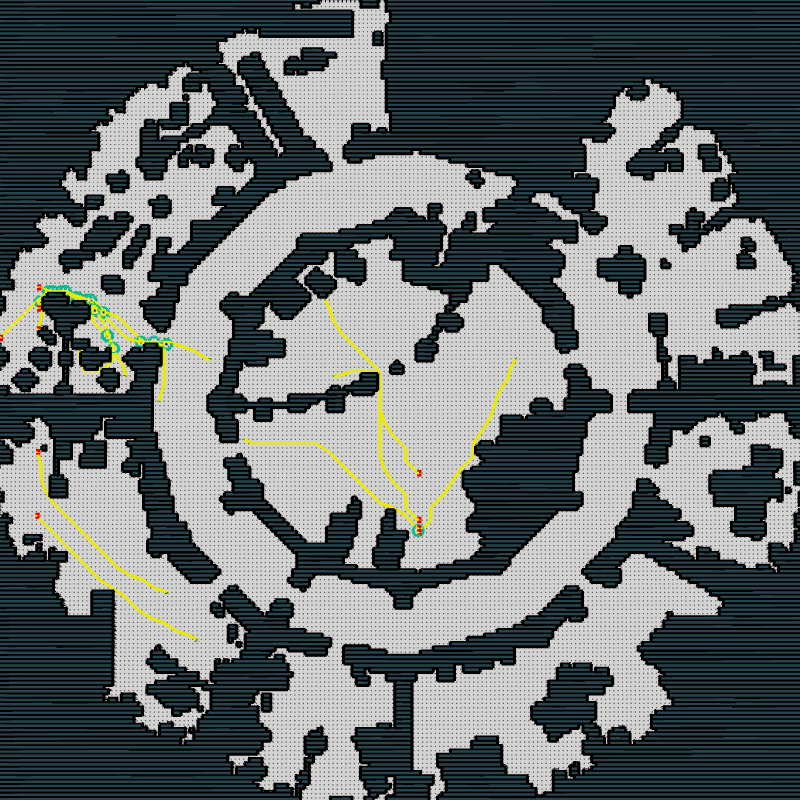
movingAI analysis
We perform the same analysis over a set of movingAI benchmarks [Sturtevant 2012]
 Egocentric
|
 Footstep
|
 PPR
PPR
|
|
\( f_{comp} \)
\( number \) \( of \) \( collisions \)
\( c(A) \)
\( p(A) \)
\( q(A) \)
|
|
The complexity analysis appears to be more accurate on the movingAI benchmarks |
Example scenarios
 $$ f_{comp} = 43.8 $$
|
 $$ f_{comp} = 1042.70 $$
|
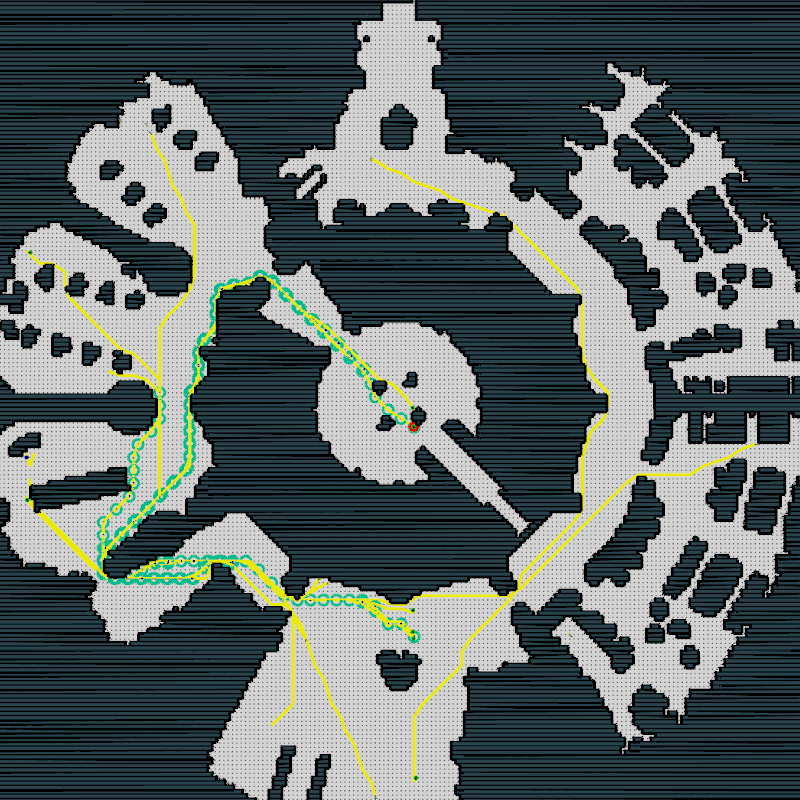 $$ f_{comp} = 9080.54 $$
|
Conclusions
- We can compare relative complexity between scenarios
- We have an understanding of what modifications can be done to alter the expected complexity of a scenario
- Having a good combination of features is important to remove bias from any subset of features when calculating the overall complexity
Limitations
- We do not capture the complexity of individual obstacle groups
- Agents traveling in groups can produce a high complexity score but many steering algorithms can solve these scenarios. However this should reflect in a lower computational performance score